South African Homeowners: Expect 0.25–0.8%/yr Solar Panel Degradation
Yes, solar panels degrade, but slowly. Modern panels typically lose about 0.25% to 0.5% of their output every year, while older panels installed a decade or more ago tend to shed 0.5% to 0.8% annually. That means a panel producing 400 watts on day one might still deliver 320 to 380 watts after 25 years. Panels rarely fail outright at the 25-year mark; more often, it's the inverter, wiring, or shading that causes the output drop owners blame on the panels.
*TL;DR:>
- Different panel technologies degrade at varying rates, with premium options like HJT and IBC panels losing around 0.25% annually, while older polycrystalline panels can exceed 0.8%.*
- Most degradation occurs within the first year due to light-induced effects, then stabilizes before potentially accelerating near the 25-year mark from material fatigue.
- Actual field degradation often surpasses warranty figures, especially in harsh climates, with polycrystalline modules degrading about 2.56% annually in Mediterranean conditions.
- Diagnostic checks such as inverter logs, visual inspections, and professional testing can differentiate between panel degradation and issues from inverters or shading.
- Proper installation choices and maintenance, like limiting thermal stress and regular cleaning, can slow degradation and prolong system performance.
Table of Contents
- What solar panel degradation actually means
- The physical causes behind panel degradation
- How fast do different panel technologies degrade?
- Is it panel aging or something else? How to check
- Slowing degradation: installation and maintenance choices that matter
- What to do when panels hit 25 years old
- Solarza's tools for modeling and diagnosing degradation
- Why the industry undersells how much technology choice matters
- Sources
- FAQ
What solar panel degradation actually means
Degradation is the gradual decline in a panel's power output over time, measured as an annual percentage loss against its original rated capacity. A panel rated at 400 watts with a 0.5% annual degradation rate produces roughly 398 watts in year two and around 350 watts by year 25. This is different from a warranty's "retained capacity" figure, which is the guaranteed minimum output a manufacturer promises at a given year, usually 25.
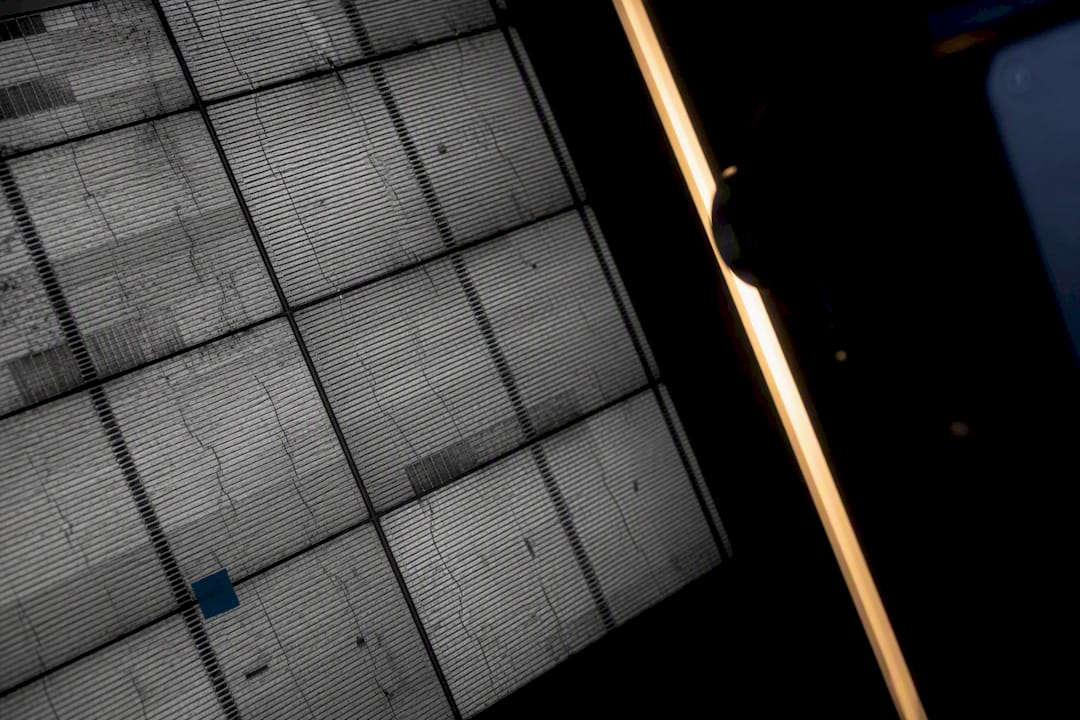
Installers and researchers measure real degradation several ways. Yield monitoring tracks actual energy production against expected output over months or years, filtering out weather noise using satellite irradiance data. Flash testing applies a controlled light pulse in a lab to measure a panel's power curve at a moment in time, useful for spot-checking used or returned modules. I-V curve testing traces the relationship between current and voltage across a panel's full range, revealing whether losses come from resistance, shading, or cell damage. Electroluminescence imaging goes further, passing current through a panel in the dark and photographing the faint light it emits. Cracks, corroded connections, and dead cells show up as dark patches invisible to the naked eye.
Warranty degradation curves matter because they set a manufacturer's baseline, not a promise of real-world behavior. The IEA-PVPS service life estimation study found that standardized qualification tests like IEC 61215 confirm a panel meets minimum durability standards, but they don't reliably predict how it will perform 15 years into a specific climate. A panel that passes IEC certification in a lab can still degrade faster than its warranty curve suggests once installed on a humid coastal roof.
The physical causes behind panel degradation
Several distinct mechanisms drive panel decline, and they don't all behave the same way or cause the same kind of damage.
Light-induced degradation (LID) hits hardest in year one. Crystalline silicon cells, especially older p-type designs, lose 1% to 3% of output within the first months of sun exposure as boron-oxygen defects form in the silicon. This loss is largely a one-time event, not an annual recurring rate. Light and elevated temperature-induced degradation (LeTID) affects newer n-type and multicrystalline PERC cells differently. It appears gradually under heat and light, can worsen for months, and then partially recovers as the defects anneal out. Manufacturers have gotten better at suppressing LeTID through firing process changes, but it remains a wildcard in some PERC batches.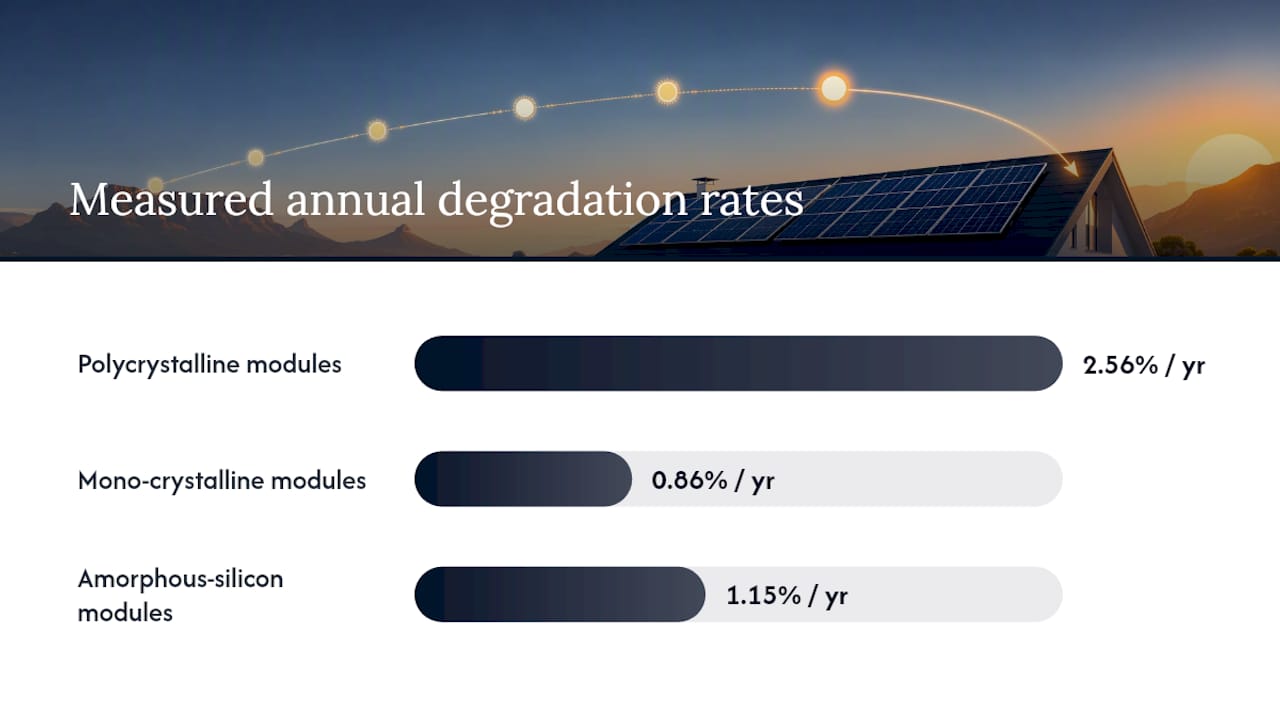 Potential-induced degradation (PID) is a system-design problem more than a cell flaw. High negative voltage between a module's frame and its cells, common in long strings on ungrounded systems, drives ion migration that shunts current inside the cell. PID is often reversible if caught early with the right inverter settings, but left unchecked it causes permanent shunting.
Mechanical and chemical aging round out the list:
- Micro-cracks from transport, hail, or thermal cycling that widen over years and create hot spots.
- Thermal cycling stress on solder joints and interconnects as panels expand and contract daily.
- EVA encapsulant yellowing, which blocks light before it reaches the cells.
- Backsheet hydrolysis and delamination, letting moisture reach the circuitry.
A 15-year forensic field study in the Mediterranean found polycrystalline modules degraded at an average of 2.56% per year, several times higher than manufacturer warranty curves suggested, while mono-silicon modules in the same climate degraded at just 0.86% and amorphous-silicon at 1.15%. The forensic teardown traced the excess polycrystalline loss to encapsulant hydrolysis and corroded interconnects, exactly the failure modes that high UV combined with sustained coastal humidity accelerates.
How fast do different panel technologies degrade?
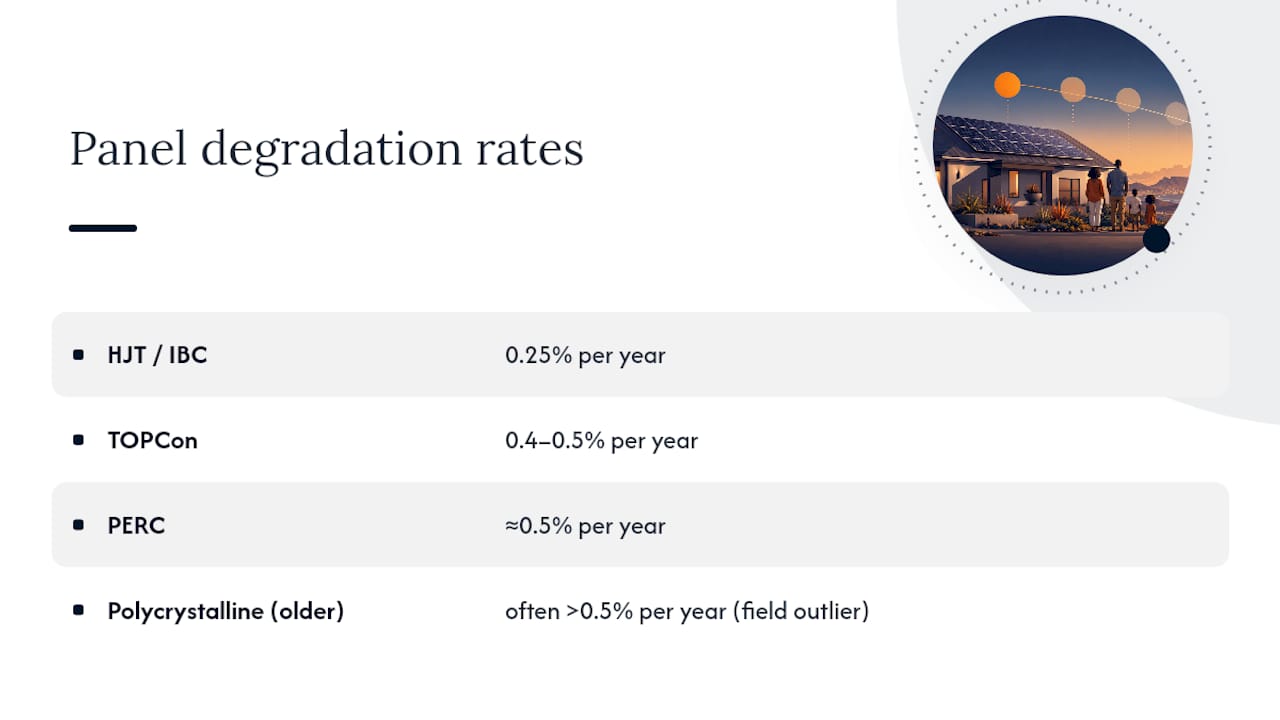
Cell chemistry sets the baseline rate, and the gap between the best and worst performers is wider than most buyers expect. Heterojunction (HJT) and interdigitated back contact (IBC) panels, the premium n-type technologies increasingly used in 2026, can degrade as little as 0.25% per year. TOPCon panels, now common in mid-to-premium residential installs, typically sit in the 0.4% to 0.5% range. Older PERC modules, still widely installed, average closer to 0.5%, and polycrystalline panels from a decade ago often exceed that, especially in harsh climates.
Degradation isn't a straight line. Most panels take a sharper dip in year one from LID, settle into a steady annual decline for 15 to 20 years, and then some show a late acceleration as encapsulant and backsheet materials finally fatigue past their tolerance.
Here's how that plays out over a panel's working life, assuming typical mid-range rates for each technology:
That polycrystalline row is the outlier worth taking seriously. It reflects the actual field-measured average from the Mediterranean forensic study, not a warranty projection, and it shows why relying on lab certification alone can mislead buyers about long-term yield in a harsh microclimate. Most panels retain 80% to 93% of original output at year 25 depending on quality and installation conditions.
Is it panel aging or something else? How to check
Before assuming your panels are failing, run through a short diagnostic sequence. Most output problems homeowners report have nothing to do with cell degradation.
- Compare seasonal output to your own history. Pull up last year's production for the same month. A 10% seasonal dip from cloud cover or shorter days is normal; a sudden year-over-year drop across similar weather is not.
- Check inverter logs and error codes. Inverters typically fail or need replacement around 10 to 15 years, well before panels do, and clipping or fault codes often masquerade as panel degradation.
- Walk the roof (or view it) for visible damage. Look for cracked glass, yellowing lamination, delamination bubbles, bird droppings, or leaf litter concentrated on specific panels.
- Rule out new shading. A tree that's grown three meters since installation can cut a string's output more than five years of normal degradation ever would.
- Escalate to professional testing if the drop persists. Ask an installer for electroluminescence imaging, I-V curve testing, or PID testing if output loss exceeds what your warranty curve predicts and the checks above find nothing obvious.
Pro Tip: Keep your commissioning report, the flash test and performance ratio data from installation day. Without a documented baseline, proving a warranty claim years later becomes a guessing game.
Slowing degradation: installation and maintenance choices that matter
The choices made at installation often matter more than anything done afterward. Standoff mounting that leaves an air gap for ventilation keeps cell temperatures lower, and every few degrees cooler reduces thermal cycling stress over the panel's life. Correct string sizing and solid earthing reduce PID risk substantially, and asking your installer about PID-resistant glass and encapsulant is worth the five-minute conversation before signing off on equipment. Reviewing options on the Solarza panels guide before committing to a brand helps you compare which manufacturers build in these protections as standard.
Ongoing maintenance is lighter than most new owners expect, but skipping it entirely costs yield:
- Clean panels two to four times a year in dusty or high-pollen regions; less in areas with regular rain.
- Inspect visually at least annually for cracks, hot spots, or nesting debris under panels.
- Set up production monitoring alerts so a sudden drop gets flagged within days, not discovered on a quarterly bill.
- Track your inverter's age against its typical 10 to 15 year lifespan and budget for replacement before it fails mid-warranty on the panels.
Pro Tip: Run a rough lifetime yield model with degradation built in using the Solarza solar calculator *before you buy.
What to do when panels hit 25 years old
Twenty-five years is a warranty milestone, not an expiration date. As the NREL summary on PV lifetime points out, panels typically keep producing well past their warranty period, and the inverter usually needs replacing first anyway.
At that milestone, run through a short checklist. What's the retained output, based on monitoring data rather than assumption? Is the inverter original or already replaced, and how close is it to end of life? Does the economics favor a full re-roof-and-repanel job, or just swapping the handful of underperforming modules a forensic test flags?
Upgrading makes sense more often than owners assume. A 25-year-old array replaced with current TOPCon or HJT panels can produce more energy from the same roof space, since efficiency gains over two decades have been substantial, and it's a natural point to add battery storage if you didn't originally. For panels genuinely at end of life, responsible recycling programs recover glass, aluminum framing, and increasingly silicon and silver, and asking your installer about disposal options before ripping panels down avoids landfill by default.
Solarza's tools for modeling and diagnosing degradation
Guessing at 25-year output is unnecessary when you can model it directly. The Solarza solar calculator lets you test different degradation-rate assumptions against your own roof and usage to see how lifetime yield and payback shift between a 0.25% and a 0.8% annual decline. The cost calculator takes that further, weighing partial panel replacement against a full system upgrade in real financial terms.
For diagnosis, Solarza's network of vetted installers across all nine provinces means you're not relying on guesswork when output drops unexpectedly:
- Locate verified installers by province through the installer directory for electroluminescence imaging or I-V curve testing.
- Get tailored quotes for panel replacement, cleaning, or inverter upgrades rather than one-size pricing.
- Compare current panel technology and pricing on the Solarza panels page if a forensic check points to an upgrade over a repair.
Why the industry undersells how much technology choice matters
That's not wrong, but it flattens a story where the gap between technologies is the real story. A buyer choosing polycrystalline over HJT in a hot, humid climate isn't picking a slightly cheaper panel; based on the Mediterranean forensic data, they may be picking a panel that loses five to ten times more output over its life.
The conventional advice also underweights diagnostics. Owners fixate on panel age when the inverter, now statistically the shorter-lived component, is usually the actual cause of a production drop. Chasing panel replacement when a $2,000 inverter swap would fix the problem wastes money on both ends.
If there's one priority worth acting on, it's this: get a baseline reading at commissioning and revisit it every few years, not just when something feels wrong. Degradation curves only become useful once you have real data to compare them against.
— Kobus Kohvik
Sources
- EPJ Photovoltaics 2026 forensic field study of PV module degradation
- IEA-PVPS service life estimation executive summary
- TheGreenWatt: degradation rates and 25-year retention by technology
FAQ
Do solar panels stop working after 25 years?
No.
What causes degradation in solar panels?
The main causes are light-induced degradation in the first year, potential-induced degradation from system voltage issues, micro-cracks and thermal cycling stress, and chemical aging like encapsulant yellowing or backsheet moisture ingress.